
The demo on this site needed five human interventions in its first week, and the scariest one returned HTTP 200 on every request. In light theme, the chat answer rendered white text on a white background. Requests succeeded. Tokens were billed. Every user on light theme saw an empty box where the answer should have been, and nothing in the system disagreed with them.
A pipeline that errors loudly is a solved problem: an alert fires and someone looks. The pipeline that quietly serves a wrong or empty answer is the unsolved one, because every signal you get for free says healthy. A status code measures whether the transport worked. It says nothing about whether the answer was right or even visible.
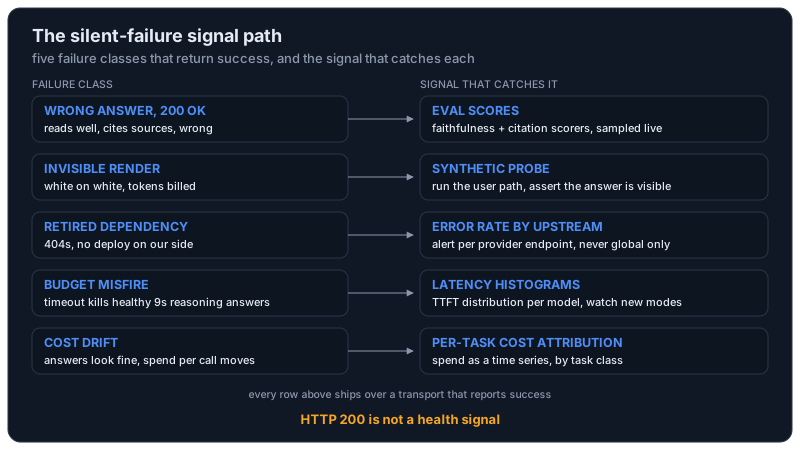
So this is the map I wanted before week one: the silent-failure classes we have actually hit, each paired with the signal that catches it. The incident log has the timeline. This post has the instrumentation.
The answer nobody could see
The white-on-white incident is the purest specimen. No exception, no log line, no alert. The pipeline did its job and the browser rendered the result in a color the background swallowed. By every measure the system had, it was working. By the only measure that matters, a user reading an answer, it was completely broken.
Backend telemetry cannot see this class, because the failure begins after the last span ends. The signal that catches it is a synthetic probe: a scheduled check that loads the page, submits a query, and asserts on what a user would perceive, including in light theme. The honest version of week one is that our probe was a human who happened to look. A human scales to exactly one system. The check that replaces that human is boring to write and runs every few minutes forever.
The dependency that stopped existing
On June 30, three days after launch, queries started failing with 404s. Nobody deployed. Nothing in our git history explained it. Google had retired the gemini-2.0-flash snapshot the demo was pinned to, and the endpoint we depended on stopped existing.
This incident produced errors, so it was loud in one sense, but silent where it counted: no signal connected the failures to their cause. A global error-rate alert says something broke and invites you to bisect your own deploys, which is the wrong instinct when the change happened in someone else's fleet. The signal for this class is error rate broken down by upstream dependency. When the breakdown reads zero everywhere except calls to one model endpoint, the diagnosis arrives with the alert. The two-commit fix and the alias policy that prevents a rerun are in the incident log post.
The budget that declared healthy answers dead
Day 4 was a config bug wearing a latency costume. The time-to-first-token budget was tuned for a model that starts talking fast. The current model is a reasoning model that spends around 9 seconds thinking before it emits a token, and the budget was regularly declaring those healthy requests dead. Legitimate requests failed. The model was fine. No error anywhere said the config was the bug.
A fixed threshold cannot catch this, because the threshold itself is the failure. A TTFT histogram per model can: the day the model changes, a second mode appears near 9 seconds, plainly visible, where an average would smear it into noise. We raised the budget to 20 seconds. The durable lesson is that every timeout tuned for model A is a latent bug waiting for model B, so latency distributions deserve a dashboard even when nothing is wrong.
Cold starts were the same class from the other side. On scale-to-zero infrastructure, the first visitor after an idle period paid the boot time plus the model call, so the demo felt broken precisely for the person deciding whether to trust it, and emitted no error while doing so. Histograms expose that bimodal shape too. The fix was one always-warm machine, and the meter now runs around the clock.
Wrong answers under a green dashboard
The heaviest class is the one we gate against rather than wait to catch: an answer that reads well and is wrong. It ships with a 200 like everything else. No infrastructure signal can flag it, because infrastructure telemetry measures the request and this failure lives in the content.
The instrument for content is a scorer. The demo runs three of them, faithfulness at 0.97, citation correctness at 0.95, and recall@k at 0.93, and we treat evals as CI: the score delta posts to every PR and a regression removes the merge button. That gate is a pre-production signal, but the same scorers are the only tool in the stack that can say anything about answer quality after deploy. Score a sample of live answers and quality becomes a time series you can alert on like latency. Status codes will never grow this capability. Semantic failures need semantic checks.
Cost drift moves first
A silent failure often spends money before it shows any other symptom. The white-on-white bug billed tokens for every answer nobody saw. A prompt that doubles in size, or a loop that retries a stage it should have failed, shows up on the invoice before any user complains. Cost per call is a health metric that happens to be denominated in dollars.
Attribution is what makes it usable. On the analytics platform we built for an IoT product, a single question can fan out from a router to multiple specialist runs, and eyeballing the bill stops working the moment that fan-out exists. Langfuse traces every request end to end there, with per-task cost attribution, so when spend moves we can see which task class moved it and whether the router or a specialist misbehaved. The bill turns from a monthly surprise into a per-task time series, and drift in cost per answer becomes an alarm that fires while the answers still look fine.
The same stack on the smallest system
The demo behind these incidents is a single-service RAG pipeline, and it still carries the standard kit, all of it open source: OpenTelemetry auto-instrumentation on FastAPI, psycopg, and httpx for traces, Prometheus metrics per pipeline stage, and structlog for structured logging. Each covers questions the others cannot. Traces answer where a request spent its time, which is how you confirm that 9 seconds live in the model rather than in retrieval. Stage metrics answer which stage degraded, so an extraction slowdown moves one counter instead of hiding inside an end-to-end average. Structured logs carry the fields for the questions you did not plan to ask.
The fields matter more than the format. One more week-one entry proves it: per-IP rate limiting was keyed on the connecting peer address, which behind the Fly proxy is the proxy itself, so every visitor shared a single rate-limit bucket. We caught it during launch hardening, a day before launch, by reading the code rather than any dashboard. The telemetry lesson generalizes: if the client-IP field in your logs holds the proxy address, every per-user question you ask gets a confident wrong answer. Instrumentation is only as honest as its labels.
What a 200 is worth
Count the week: five incidents, and the only one that announced itself was the 404s. A green dashboard built from status codes would have slept through the white-on-white answers and the cold starts entirely, and would have pointed the 404 investigation at our own deploys.
HTTP 200 means the bytes arrived. Whether the answer was right takes a scorer, and whether anyone could see it takes a probe. The transport was never the hard part. The systems that carry this stack are summarized in the operator brief, and the pipeline that produced the incident log is answering questions right now at the live demo, returning 200s that mean exactly as much as this post says they do.