
Readers of this series have already met this platform in pieces: the 850-tool MCP server, the Gemini 2.5 to 3.5 migration under live traffic, the per-task cost attribution. Those posts kept it anonymous by role. The operator brief states the rest, so this post can too: it is a Series-B DeFi company, the engagement is founder-direct under NDA, and this is the whole system told once, end to end, with the war story the other posts skipped.
The product question the platform answers sounds simple: let users ask market questions in plain language and get grounded answers about tokens, assets, swaps, and on-chain conditions. The engineering answer is an agent-driven pipeline where the model's job is a fraction of the work and the layers underneath it are the reliability story.
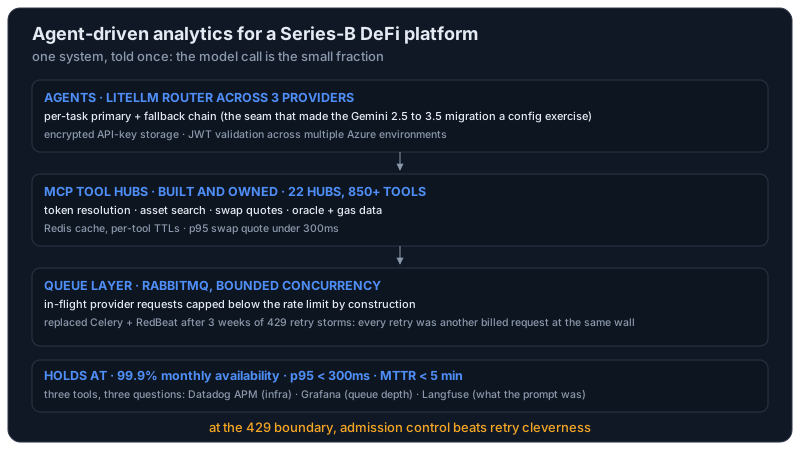
The shape of the system
An agent that answers "what would this swap cost right now" needs live hands, and the hands are MCP tool servers we built and own: token resolution, asset search, swap quotes, and oracle and gas data. At platform scale that toolchain grew to 22 hubs exposing more than 850 tools, which created its own selection and context problems; the MCP post covers that layer, including the Redis cache with per-tool TTLs that keeps p95 swap-quote latency under 300ms.
Model calls route through LiteLLM across three providers, with per-task primaries and fallback chains, which is the seam that later made a multi-service model migration a config exercise instead of a rewrite. Security sits in code rather than convention: encrypted API-key storage and JWT validation across multiple Azure environments, because a platform that quotes swaps holds keys someone would very much like to have.
None of this is the glamorous part. That is the point of publishing it. Roughly 90% of making agents production-grade on this platform was tool servers, caches, queues, and key handling, and the model call was the remaining fraction.
Three weeks at the 429 boundary
The war story this series had not told yet is the embedding pipeline. The first build ran it on Celery with RedBeat scheduling, a reasonable default we have defended elsewhere in this series. Then it met the provider's rate limits.
A 429 response to a Celery task triggers a retry. A retry is another billed request aimed at the same rate-limit wall, arriving alongside every other task's retries, which means the pipeline responded to "slow down" by speeding up. Backoff tuning softened the shape but not the fact: with enough concurrent workers, the aggregate retry pressure stays above the provider's ceiling, and the queue converts rate limiting into a storm. We spent three weeks tuning retries before accepting the diagnosis, and the fix was structural: move the pipeline to RabbitMQ with bounded concurrency, so the number of in-flight provider requests is capped below the rate limit by construction. The retries mostly disappeared because the 429s mostly disappeared. The ADR for that switch lives in the client's repo, and the lesson travels: at a rate-limit boundary, admission control beats retry cleverness.
The migration, and what the numbers hold at
The Gemini 2.5 to 3.5 migration crossed this platform's RAG indexing, its AI guardrails with PII anonymization, and its eval-scoring pipelines while the platform stayed up, which is only worth one sentence here because the migration post walks it stage by stage. What made it boring in the good way was the routing seam above plus eval gates that traveled with every routing change.
The operational envelope it all holds at, monthly: 99.9% API availability, p95 swap quotes under 300ms, and mean time to recovery under 5 minutes. The MTTR number is the one that takes explaining, because it comes from three tools answering three different questions. Datadog APM answers what the infrastructure did. Grafana queue-depth dashboards answer whether work is backing up, which after the 429 episode is a first-class signal. Langfuse prompt traces answer what the model was actually asked, which is the question infrastructure telemetry cannot see. An incident that pages gets triaged across all three, and the answer is usually obvious in one of them within the first minutes; the silent-failures post generalizes that stack.
One person, 117 PRs in the peak week
The engagement runs founder-direct in player-coach mode, and the peak week landed 117 merged pull requests. That number is not a typing story. It is the review-bandwidth method documented in how a one-person consultancy ships: coding agents in parallel lanes, machine-run gates, one human integrator whose name is on every merge. The same method, pointed at a client's production codebase instead of a demo.
What a prospective client can verify
Anonymized case studies deserve skepticism, so here is the verification path. The platform's SLOs, stack, and the migration are itemized in the operator brief, which also notes that the founder takes a 30-minute reference call after a mutual NDA. The method that produced the delivery cadence is public across this series. And the smallest end of the same discipline runs in the open at the live demo, where you can watch a document pipeline built by the same hands hold its own eval-gated numbers. The claims that must stay behind the NDA are the client's name and code; the engineering is all here.