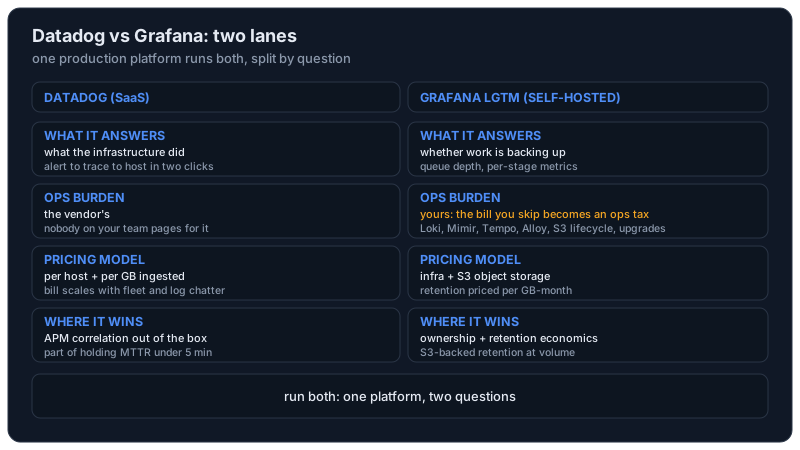
We run Datadog and Grafana in production at the same time, on the same platform, on purpose. On a client platform we operate, Datadog APM anchors the triage stack that holds MTTR under 5 minutes, and Grafana queue-depth dashboards run right beside it watching the async pipelines. Datadog tells us what the infrastructure did. Grafana tells us whether work is backing up. Those are different questions, and no single tool on that platform answered both well enough to fire the other.
Most Datadog vs Grafana comparisons are written by someone selling one of them. We pay for one and operate the other, so this comparison is priced in engineer-hours as well as dollars. Below: what Datadog buys, what the self-hosted Grafana stack buys, a feature table, and the decision rules we apply when a new system needs eyes on it.
What Datadog buys
The product Datadog actually sells is correlation. On the client platform, an alert fires, the APM trace for the slow endpoint sits two clicks away, and the host metrics and logs for the same time window live in the same view. Nobody on our side assembled that; it came with the agent. When the MTTR target is 5 minutes, the minutes you do not spend switching tools and aligning timestamps are the whole budget.
The second thing it sells is the absence of ops. Nobody on the team upgrades Datadog or takes a page when it degrades. That property matters most at the worst possible moment: an observability stack must not share fate with the systems it observes, and a SaaS running on someone else's fleet does not.
The cost of those two properties is a bill that scales with your infrastructure. As of mid-2026, the pricing model is per host for infrastructure monitoring and APM, plus per-GB charges for log ingestion, with indexing and retention priced separately from ingest. I am not quoting dollar figures because they change; the shape is what matters. When an autoscaler doubles the fleet for an afternoon, or a deploy starts logging at debug level, the invoice moves with it. On the client platform, cost review is a recurring engineering task, and that meta-work belongs in Datadog's true price.
What the LGTM stack buys
FundAtlas runs the other lane: a full self-hosted LGTM stack on EKS, with Loki for logs, Mimir for metrics, Tempo for traces, and Grafana Alloy as the collection agent. Telemetry persists to S3-backed retention, and the stack deploys through ArgoCD GitOps with roughly 60-second auto-rollback, exactly like any product workload.
The first thing self-hosting buys is ownership. Retention policy is a config value we set, and cardinality limits are knobs we turn rather than pricing tiers we negotiate. Telemetry never leaves our AWS account.
The second is retention economics. Logs and traces in S3 cost object-storage prices per GB-month instead of SaaS ingestion-plus-retention pricing. At small volume the difference is noise. At the volume FundAtlas produces, and at the retention lengths it keeps, the curve bends hard toward self-hosting.
The honest part is the ops tax, and it deserves names instead of a hand-wave. On FundAtlas, someone had to size the Mimir ingesters, tune the Loki compactor, write the S3 lifecycle rules that make the retention economics true, keep every Alloy config in git, and carry the page when the observability stack itself degrades. That someone is us. The roughly 60-second ArgoCD rollback caps the damage of a bad config push, but a cap on damage is still damage.
The feature table
This is the comparison as we would hand it to a team choosing today. Where a cell depends on volatile pricing, it describes the pricing model rather than a number.
| Capability | Datadog | Grafana / LGTM (self-hosted) |
|---|---|---|
| Metrics | agent-collected, custom metrics priced by volume | Mimir, Prometheus-compatible; scale limited by your own capacity |
| Logs | per-GB ingestion with fully indexed search | Loki indexes labels only; cheap to store, needs query discipline |
| Traces | APM spans with tiered retention | Tempo on S3; long retention stays cheap |
| APM | the flagship: auto-instrumentation and cross-signal correlation out of the box | assembled from OpenTelemetry plus Tempo; correlation is a project you build |
| Alerting | monitors with anomaly detection included | Grafana alerting plus Alertmanager; rules live in git |
| LLM / prompt visibility | an LLM observability product exists as of mid-2026; we still run a separate prompt layer | nothing built in; OTel GenAI conventions are early; separate layer here too |
| Pricing model | per host plus per GB ingested | infrastructure plus S3 storage plus engineer time |
| Ops burden | the vendor's | yours, on-call included |
The LLM row is the one that surprises teams. Neither lane sees inside an AI pipeline at the level that matters: whether retrieval returned the right chunks and whether the answer stayed faithful to them. That visibility is a separate layer no matter which lane you pick, and we mapped it signal by signal in the silent-failures post.
Run both: one platform, two questions
The client platform is our argument that this choice can be a false binary. The recurring shape of a triage there: a latency alert fires in Datadog. The APM trace shows the request handler healthy and fast. The Grafana dashboard beside it shows queue depth climbing since the last deploy. Diagnosis inside the 5-minute MTTR window: the problem is worker throughput, so the fix is scaling consumers, and rolling back the API would have done nothing.
Either tool alone tells half that story. Datadog alone shows healthy requests and no cause for the alert. Grafana alone shows a rising queue with no request-side context. Side by side they close the case in minutes, which is why both keep their seats.
Decision rules
The ones we actually use:
- No platform team, and an incident could page you tonight: pay Datadog or another SaaS. The ops tax would cost you more than the invoice does.
- Telemetry volume growing faster than headcount, and a platform team in place: self-hosted LGTM with S3 retention wins on economics, and the win compounds with retention length.
- A rule that telemetry cannot leave your account: self-host. This constraint dominates every other row of the table.
- AI workload in either lane: budget a prompt-visibility layer separately, because neither lane provides it.
- Already running both by org-chart accident: keep both, but split them by question rather than by team, the way the client platform splits "what did the infrastructure do" from "is work backing up".
Our own default for new small systems lands on the Grafana side of the fence. The doc-intel live demo runs Prometheus per-stage metrics with OpenTelemetry tracing, because a single-service pipeline does not need an APM subscription and we already carry the LGTM operating knowledge from FundAtlas. The rest of the systems behind these claims are summarized in the operator brief. No winner gets declared here because production has not declared one: one lane answers what the infrastructure did, the other answers whether work is backing up, and the platform that pays for both gets both answers.